Fishing & Hunting Lodge Revenue & Expense Analysis
Preface
Canada’s Fishing and Hunting Lodge industry is part of how we showcase our beautiful nation to the world. This industry introduces guests to the beauty of our untouched wilderness and the generous bounty that it offers.
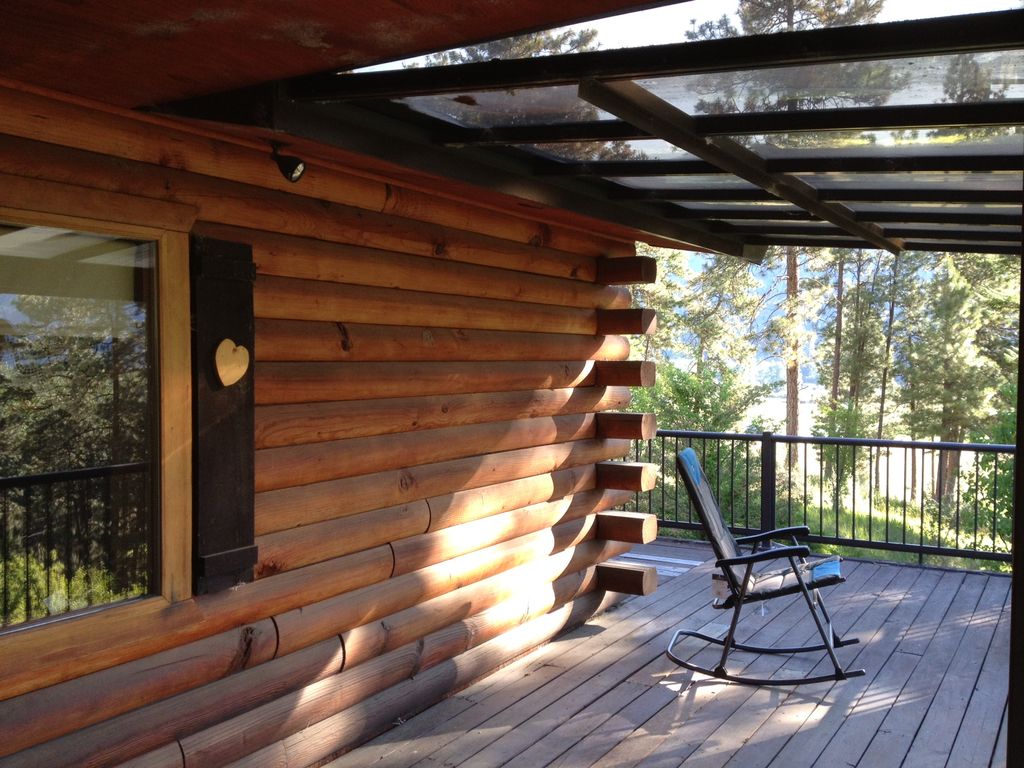
These lodges are Canada. They are surrounded by our nation’s beauty. Some are more remote than others, however, all of them take us back to a lifestyle and an environment that tickles our soul and reminds us of simpler times.
Looking around these lodges you will see pristine lakes, untouched forests and wildlife that can only be truly appreciated by being observed in this natural habitat. This scenery encourages visitors to leave their electronics at home and take a break to connect with nature again.
This revenue & expense analysis report has been prepared to benefit these Canadian Fishing & Hunting Lodge owners by supporting strategic business planning. It is also intended to provide sound research for the lending institutions that serve lodge operations, as well as all other participants in this wonderful industry.
The consultant has benefited from discussions with owners, associations, lenders and his fishing & hunting lodge appraisal files. In particular, we thank the lodge owners who participated in the survey.
If you find this information valuable, we ask that you pay it forward and send this research report to a fellow lodge owner or lender. The more-healthy businesses we help create, the more the whole industry can prosper.

Section 1: Objective
Fishing & Hunting Lodges are a complex combination of real estate and business assets that are very difficult to assess from the perspective of evaluating their performance against industry standards.
Part of the reason for the difficulty analyzing the strength or weakness of a fishing & hunting lodge operation is that there is very minimal in-depth research available that gives you a look “under the hood” of comparable operations.
This lack of research makes it tough for estimates of market value to be determined, difficult for mortgage lenders to feel comfortable underwriting loans, hard for owners to plan retirement, and troublesome for buyers wanting to assess a potential acquisition.
It’s been my pleasure to have spent hundreds and hundreds of hours travelling across the country visiting beautiful, remote fishing & hunting lodges, analyzing their businesses and discussing the industry with the owners. Now I hope it will benefit you.
Why This is Useful to Owners, Lenders & Associations:
You may think that every lodge operation is completely unique, but as you will see in the forthcoming analysis, there are many patterns between fishing & hunting lodge revenue & expense statements that are useful to be aware of.
This information can be used in the following ways:
- Mortgage lenders underwriting loans can assess whether a lodge is being managed well based on the revenue per guest cabin being produced & percentage of expenses the lodge is operating at.
- When seeking purchase financing to buy a fishing and/or hunting lodge, applicants are often asked to prepare a business plan including financial projections. This revenue & expense analysis provides a great starting point for these projections.
- By knowing the general ranges for revenue & expenses of comparable operations, owners can now analyze their own operation and see where a particular expense category may fall outside the “normal range”.
- We utilize this information in our appraisal reports in order to see if there is an expense that may have gotten a bit out of control and if managed properly could increase your business’ market value by increasing net income.
- This information is useful for owners considering expanding their operation (adding new cabins) and need to prepare financial projections justifying the expansion to mortgage lenders.
Methodology:
Data Selection:
We wish that our data was perfect – but we felt its better to have this information out as a start to digging deeper on this industry than to have no research out there at all.
Unfortunately, our sample size is limited to 15 lodges of a mix of boat-in and road-access with only a small amount offering American Plan – each comparable is labelled as such.
Obviously, it would have been more ideal to have a larger sample size of say 20 fly-in lodges, 20 boat-in lodges & 20 drive-in lodges or 20 American Plan Lodges & 20 Housekeeping Lodges.
The reason for the smaller sample size is we felt it was more important to keep the 3-year time frame the same for all of the income & expense statements being compared – to do this meant we had to have each lodge’s revenue & expenses for the same 3 years which limited our data options.
As we are comparing expenses as a percentage of revenue it was important to be utilizing the same recent time period – the fishing & hunting lodge industry is known to experience its peaks and valleys, utilizing different time periods would’ve made the information that could be gained of less value.
Fishing & Hunting Lodges that were non-viable businesses were also excluded because the real question we’d like to answer is – What does an average or good fishing & hunting lodge business revenue & expense statement look like and what should an owner be striving for?
The lodges utilized are all what would be considered “remote lodges” which means they are located in unorganized territories away from any city centres. I consider this a market unto itself, even if they are spread across the remote parts of multiple provinces.
Revenue & Expenses:
As mentioned under the “Data Selection” heading above, we utilized 15 Fishing & Hunting Lodge Revenue & Expense Statements in our analysis – for each lodge we had a 3-year history from the same recent time frame.
In order to generate more accurate calculations, we attempted to normalize the data by utilizing the 3-year averages of revenue and each expense.
Revenue has been broken down and compared based on the amount earned per guest cabin. The number of beds in a guest cabin varies, however, the same as hotels are analyzed based on their number of rooms (which could include a king size bed, queen or two doubles, etc) – a common denominator for comparison purposes needed to be established and we felt revenue per guest cabin was most appropriate. The guest cabins at each lodge comparable generally ranged from 4 to 6 beds.
Also similar to hotels, the size and amenities of the main lodge varies the same as the main lobby of hotels does – with some having restaurants and other amenities. In theory, a high-quality main lodge with lots of amenities should be factored into the revenue per guest cabin because adding a grand main lodge and lots of amenities should increase the revenue obtained per guest cabin.
Certain expenses were grouped together in order to fully align all of the operating statements.
Because bank charges and interest, amortization and loan payments are individual to the owner, they are not considered in the calculation of net income.
All values are in Canadian dollars.
Section 2: Comparable Fishing & Hunting Lodge Operation Statements
A fishing & hunting lodge’s financial reports are like a blood pressure reading for its owners, showing whether or not the business is in good financial health.
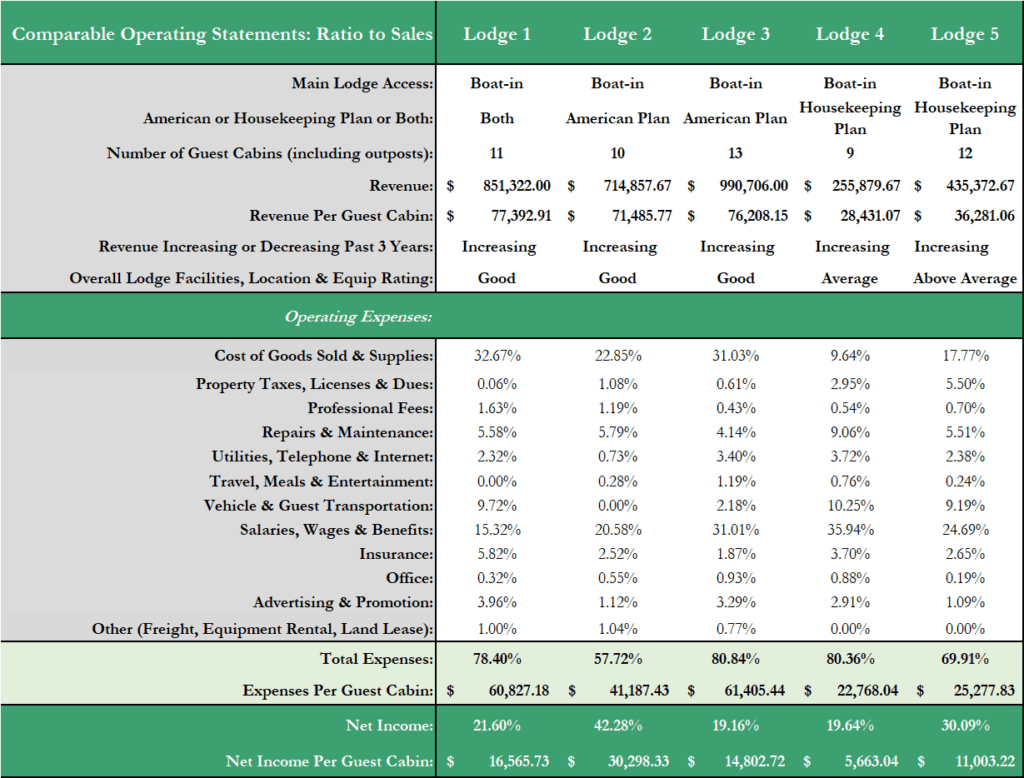
Below you will find the 15 comparable fishing & hunting lodge operating statements that we’ve dissected. We’ve analysed these statements using the percentage of sales method.
The percentage of sales method is a type of financial statement analysis in which all expenses are expressed as a percentage of sales (revenue). In other words, financial statement line items such as cost of goods sold & supplies, wages, advertising and net income, are each calculated as a percentage of revenue.
Owners & lenders can use these percentages to track trends. For example, if the cost of goods sold & supplies percentage increased 30 to 40 percent next year, the owner would have to examine why their operating costs are increasing relative to revenue. The goal for owners is to ensure costs increase proportionately to revenues.
With this information, an owner can look further into expenses and implement effective cost cutting procedures where appropriate. Owners should perform this analysis on each expense item to track their business’ financial progress year over year.
Below are the 15 comparable fishing & hunting lodge operating statements:
Section 3: Revenue & Expense Analysis
A fishing & hunting lodge jam-packed with guests isn’t always a profitable lodge. Along with keeping guests happy and improving expense management, increasing revenue is one of the three main challenges that fishing & hunting lodge businesses face.
The following pages provide our main observations after having compared the revenue per guest cabin and various expense categories of the comparable lodge operations side by side.
Revenue Analysis:
In the fishing & hunting lodge industry, revenue management is fundamental for success, with many lodges not achieving profitability until 80% occupancy is reached.
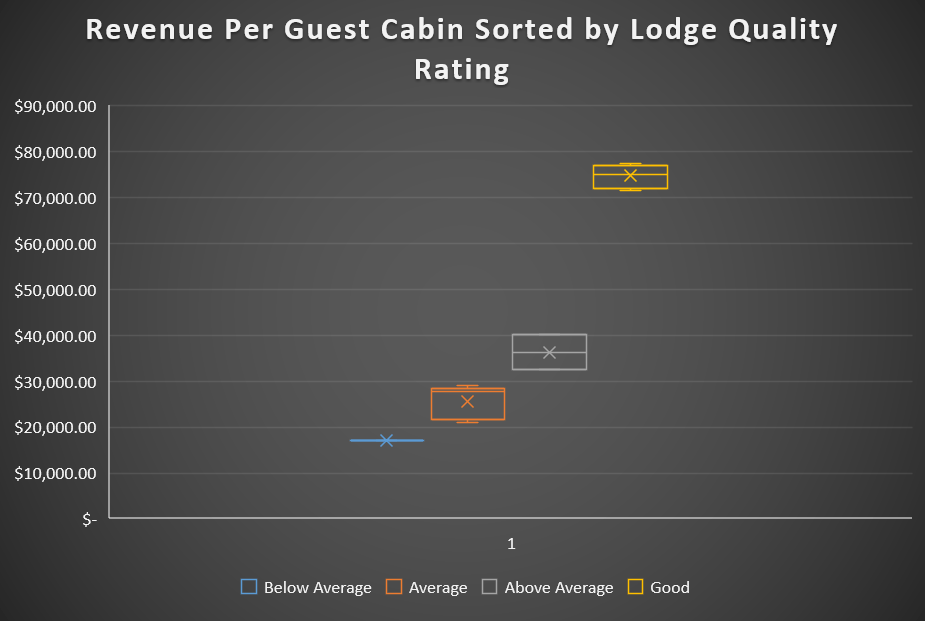
That said, there is a cap on the amount of revenue each lodge can obtain – higher quality lodges can charge more than lower quality lodges – knowing where your lodge stands as far as a quality rating will be give you a better indication as to how much revenue comparable lodges are earning per guest cabin. To aid in this, we’ve developed a rating system and applied it to the lodge comparables.
Rating System:
In the comparable operating statements section above you will see a rating at the top of each lodge comparable.
Obviously, there is some subjectivity when it comes to giving a lodge a quality rating but, if you’ve been around the industry for any length of time you know a good quality operation when you see one and vice versa.
Nonetheless, in order to remove some of the subjectivity – a rating system was established for the lodges based on the following 4 criteria:
- Location/reputation of the fishery and/or hunting territory
- Quality of facilities (guest cabins, main lodge, outbuildings)
- Quality of equipment (boats, motors)
- Strength of the overall business operation
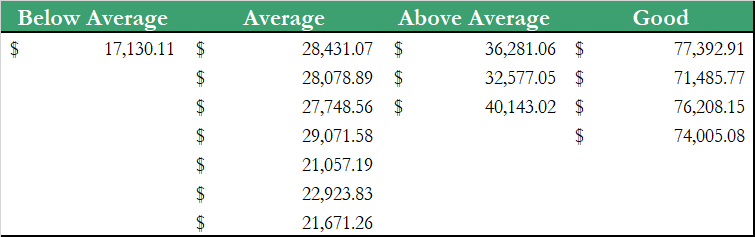
Under each criteria a rating of 1 to 4 was given; 1 signifying below average, 2 – average, 3 – above average, 4 – good. This makes for a total of 16 points available.
- Below Average Quality Lodges – 4 to 6 points
- Average Quality Lodges – 7 to 9 points
- Above Average Quality Lodges – 10 to 12 points
- Good Quality Lodges – 13 plus points
Main Observations:
- 10 of the 15 lodges were experiencing increasing revenue over the past 3 years. 3 of the 10 lodges were experiencing stable revenue and 2 were experiencing decreasing revenue. These results are a bit misleading because as we mentioned in the data selection section, we excluded all non-viable businesses. Regardless of discarding these businesses from the analysis, verbally we have received reports from many additional lodge operations that they have been experiencing steady revenue growth the past 3 years.
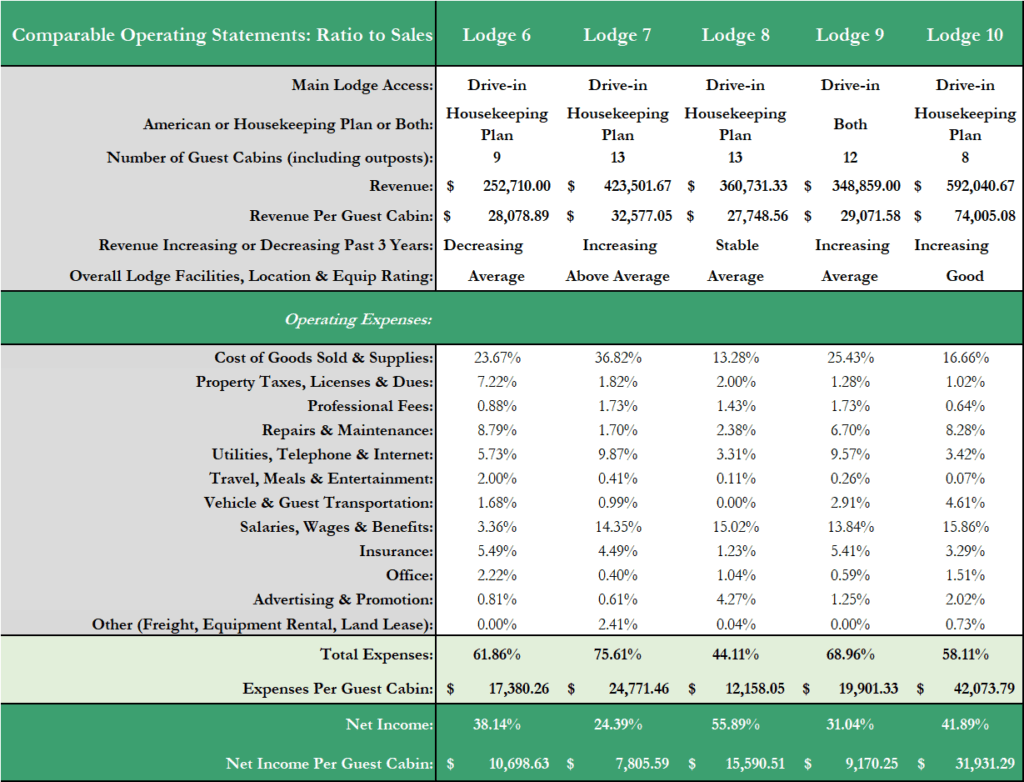
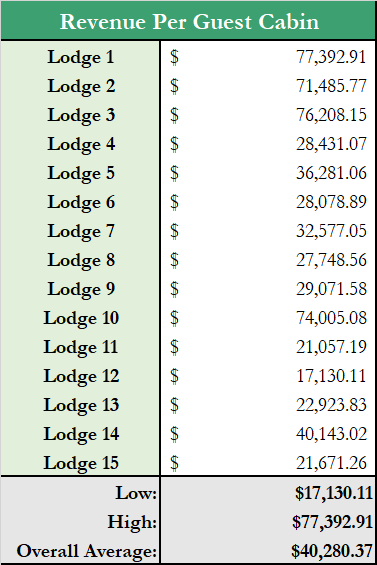
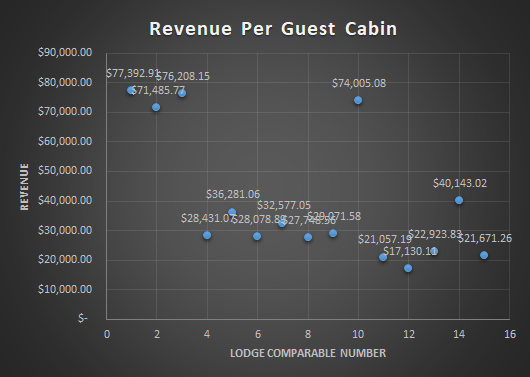
- Lodges 1, 2, 3 and 10 are achieving the highest revenue per guest cabin – closer inspection reveals these four lodges are all of the lodges that received a quality rating of “Good”. Lodges 1 & 2 are our only strictly American Plan lodges in the analysis, lodge 3 offers a mixture of American Plan and Housekeeping plan, while lodge 10 is strictly housekeeping but is a very upscale operation. These “Good” quality lodges are earning between $71,486 to $77,393 per guest cabin.
- Lodges 5, 7 and 14 are achieving the next highest amount of revenue per guest cabin – ranging from $32,577.05 to $40,143. These three lodges all received a quality rating of above average. All three lodges offer strictly housekeeping plans.
- There is a large cluster of lodges earning between $20,000 and $30,000 in revenue per guest cabin. These are all primarily housekeeping plan lodges of average quality.
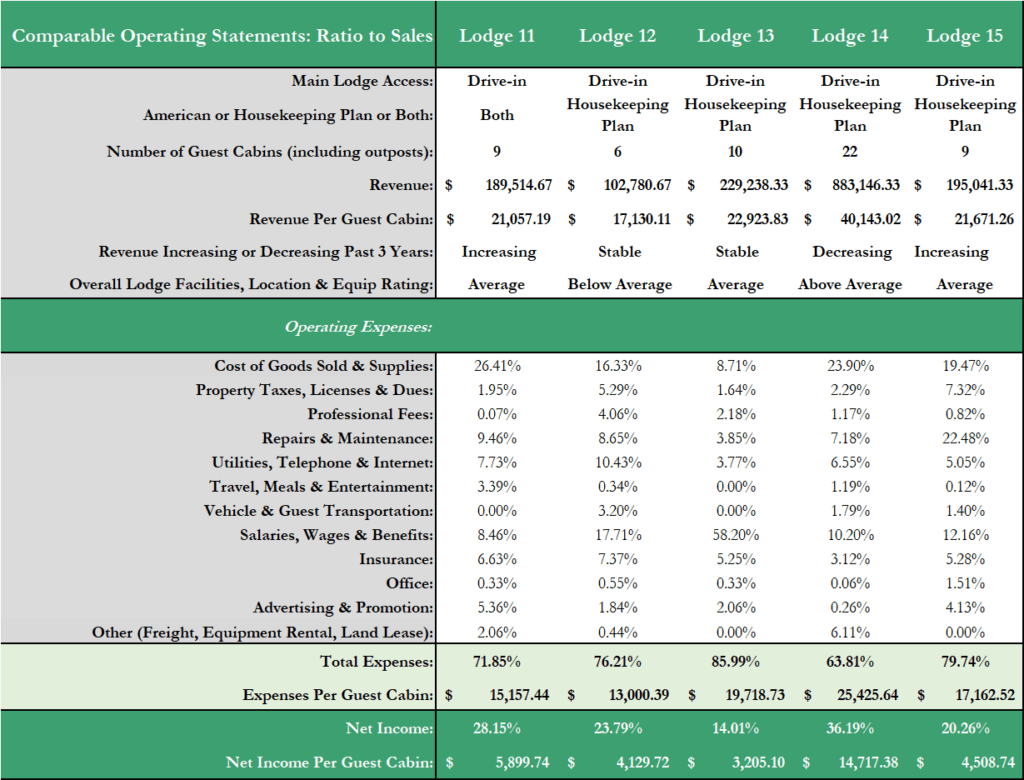
- Lodge 12 is earning the lowest amount per guest cabin at $17,130. Without a doubt this is lowest quality lodge in the analysis – with below average quality facilities, little amenities and on a less reputable lake than the other lodges.
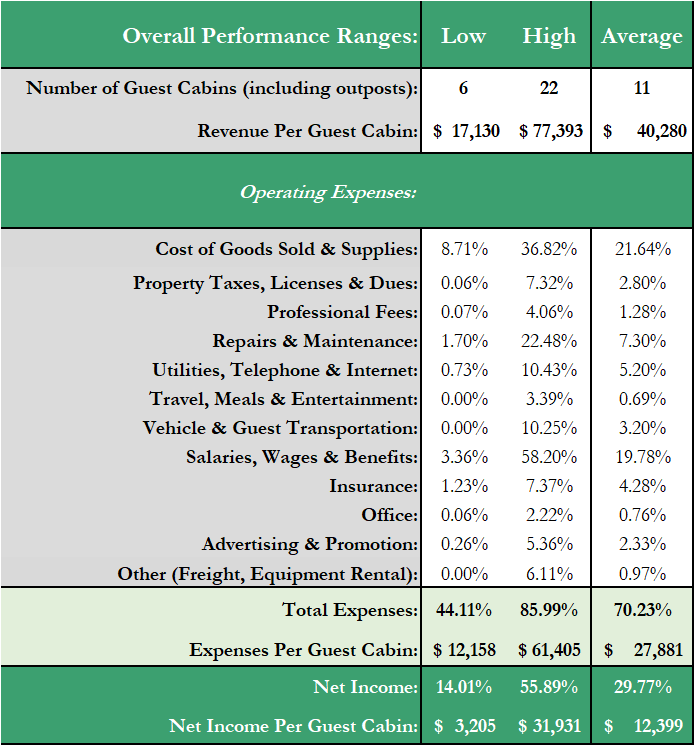
- Overall revenue per guest cabin ranges from $17,130 to $77,393 with an average of $40,280.
Expense (Operating Ratio) Analysis:
Fishing & hunting lodge owners must keep operating expenses under control without adversely affecting the business’ earnings and ability to compete with its competitors.
The percentage of sales method for analyzing the expenses of a fishing & hunting lodge business provides invaluable information that can help owners assess the business’s financial health.
Lodges incur some expenses that should increase proportionately to revenue increases, while other expenses are independent of the level of revenue being produced. Cost of goods sold and supplies expense are examples of expenses that are tied to revenue production. While insurance would be an example of an expense that is independent of the level of revenue produced.
While there is a lot of data within this report, one simple calculation provides a tremendous amount of insight. This is the expense-to-sales ratio, also called expense ratio or operating ratio.
The expense ratio is calculated by dividing your operating expenses by your revenue and multiplying the result by 100. This creates the percentage of expenses to revenue.
The expense ratio helps define the business’ financial health and its ability to scale operations up or down. The smaller the ratio, the better the chances are that the fishing or hunting lodge has to generate profits, even if the revenues go down.
The below operating expenses are incurred on an annual basis. They range from general and administrative expenses to operating expenses relating to the operation and upkeep of the business. We have examined the expenses line by line and developed ranges that all lodges would be expected to fall within.
Main Observations:
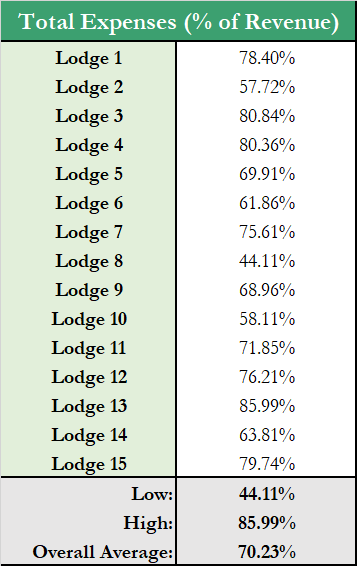
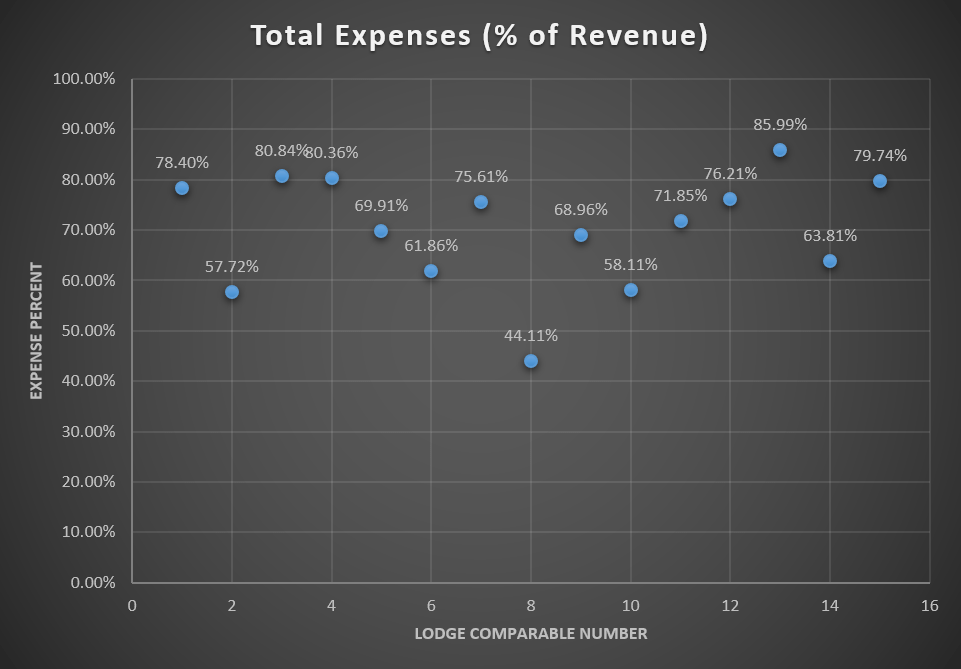
- 11 of the 15 lodges have expense ratios (operating ratios) that are between 60% to 80% of revenue. The overall average operating ratio is 70.23%.
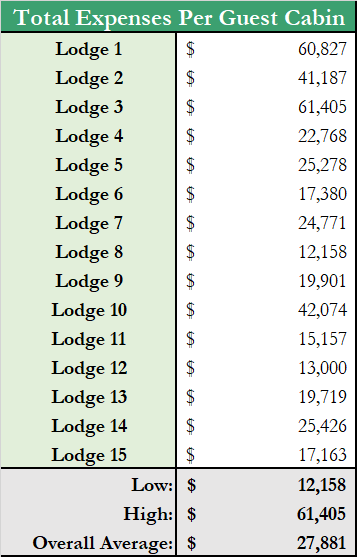
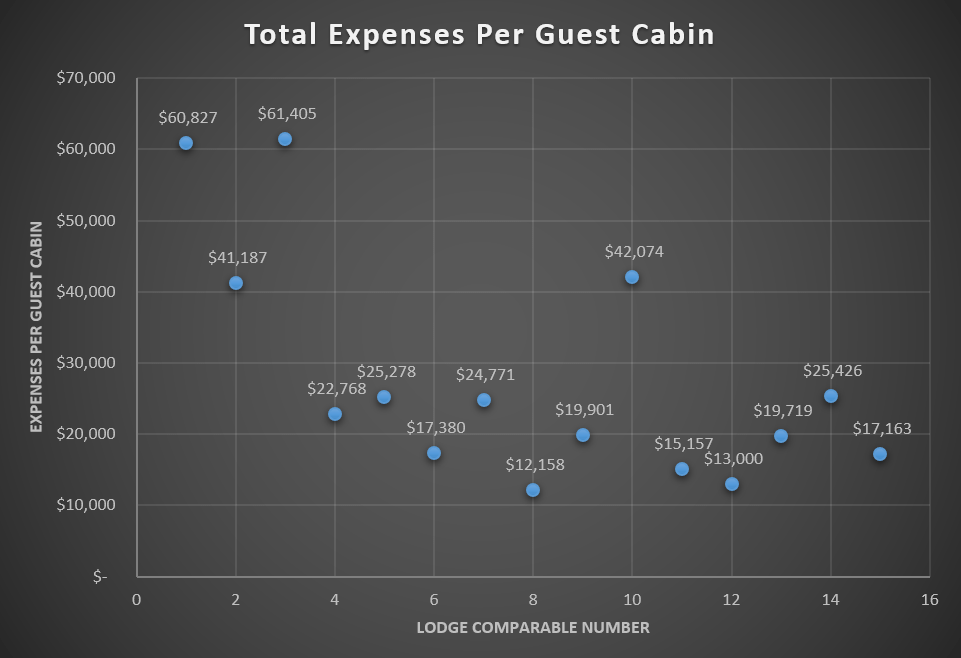
- 11 of the 15 lodges have expenses on a per guest cabin basis between $12,000 and $25,000. The overall average for total expenses on a per guest cabin basis is $27,881.
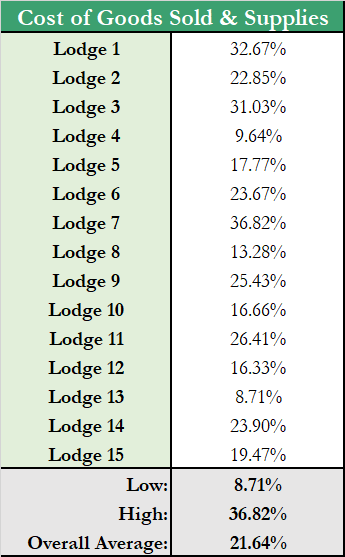
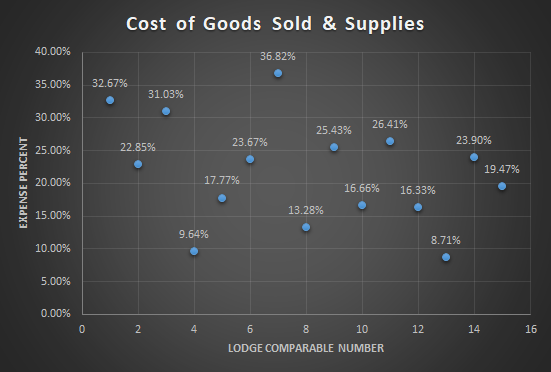
- Lodge 8 is controlling expenses exceptionally well with an operating ratio of only 44.11%. Lodge 8 is a drive-in fishing & hunting lodge that offers strictly housekeeping plans and has a higher than average number of guest cabins at 13. Further analysis reveals this lodge is operating significantly more efficiently in the cost of goods sold & supplies expense category at 13.28% of revenue which is far below the overall average of 21.64%. This lodge is also spending the second highest amount on advertising and promotion at 4.27% of revenue compared to overall average of 2.33%.
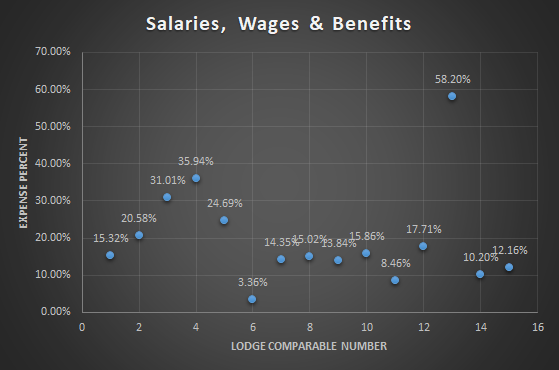
- Lodge 13 has the highest overall operating ratio at 85.99%. This is due primarily to a difference in accounting practice relating to salaries, wages and benefits. At 58.20% – this expense item far exceeds the overall average of 19.78%. If reduced to the average this lodge would be performing well.
- On a per guest cabin basis lodges 1 & 3 have the highest expenses at $60,827 and $61,405 respectively. Followed by lodges 2 & 10 at $41,187 and $42,074. Not surprisingly, these four lodges are the only four lodges to receive a “Good” rating and are also the highest earning lodges on a per guest cabin basis as well. This bodes well for the old adage “it takes money to make money”.
- Overall operating ratios range from 44.11% to 85.99% with an average of 70.23%. On a per guest cabin basis, expenses range from $12,158 to $61,405 with an average of $27,881.
Cost of Goods Sold & Supplies:
Cost of good sold and supplies expense relates to those items essential to providing the amenities, services and quality of experience promised to guests. As mentioned above, this is an expense item that should increase or decrease proportionately to revenue production.
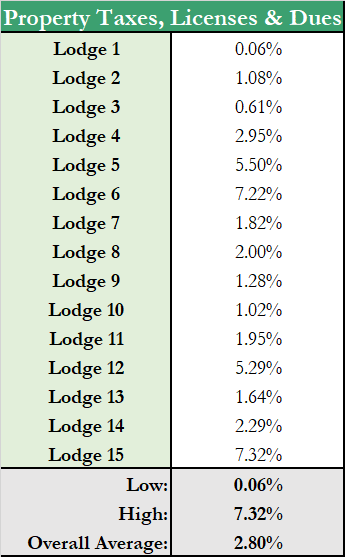
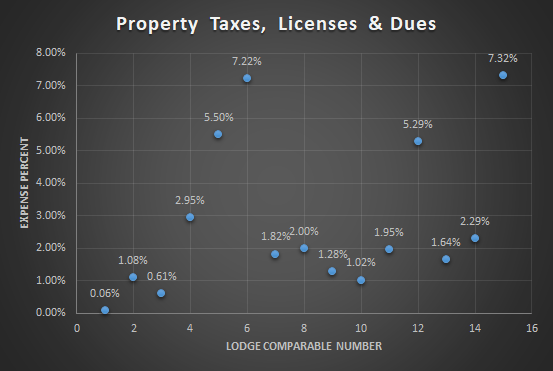
Property Taxes, Licenses & Dues:
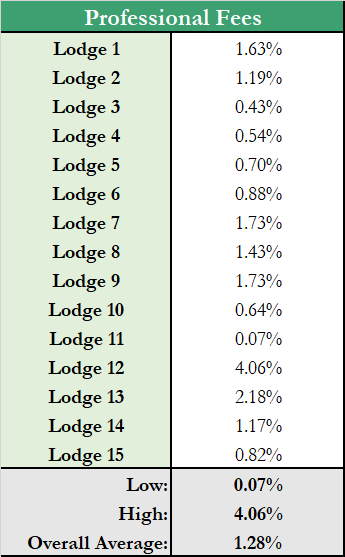
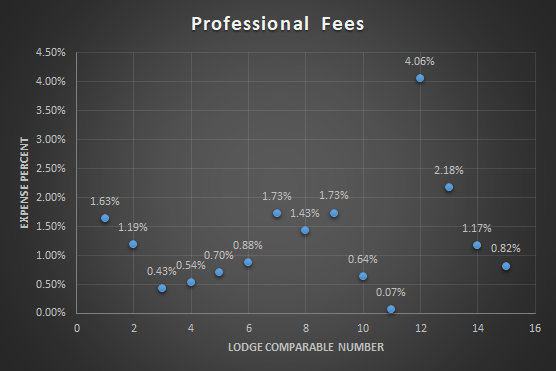
Professional Fees:
Professional fees are fees incurred for external professional advice or services, including consulting fees.
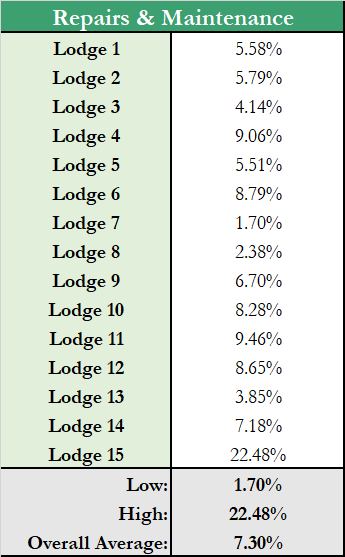
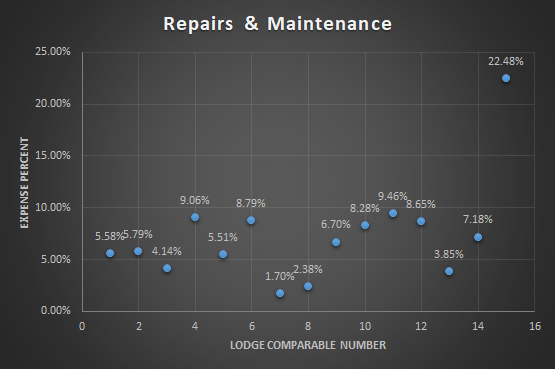
Repairs & Maintenance:
Repairs and maintenance is an expense category that is largely controlled by ownership/management. Except for repairs that are necessary to keep the lodge open and prevent damage, most maintenance can be deferred for varying lengths of time. Maintenance is an accumulating expense. If management elects to postpone performing a required repair, it has not eliminated or saved the expenditure, it has only deferred payment until a later date. Lodge 15 has the highest percent – this lodge was completing significant renovations over the course of the 3-year period analyzed.
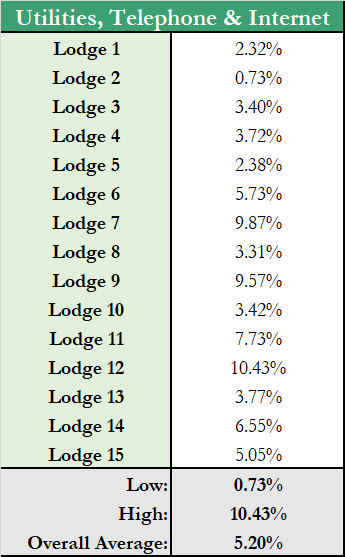
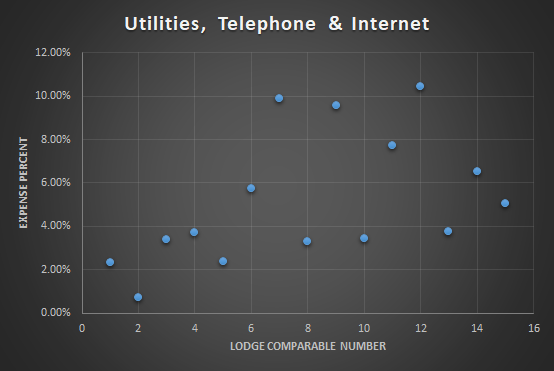
Utilities, Telephone & Internet:
Utilities, telephone & internet expense in a fishing & hunting lodge takes several forms, including space heating, lighting and other miscellaneous power requirements. Lodge 2 is a completely “off-grid” lodge operating on generator electricity. This lodge also has exceptional revenue which lowers this expense percent.
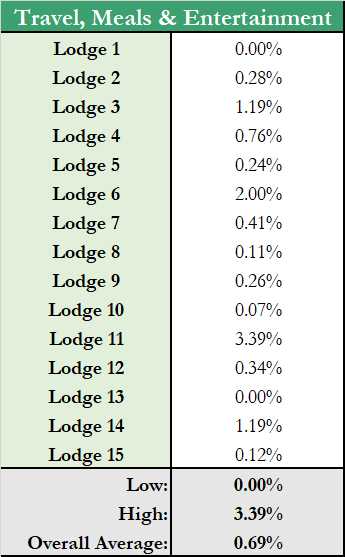
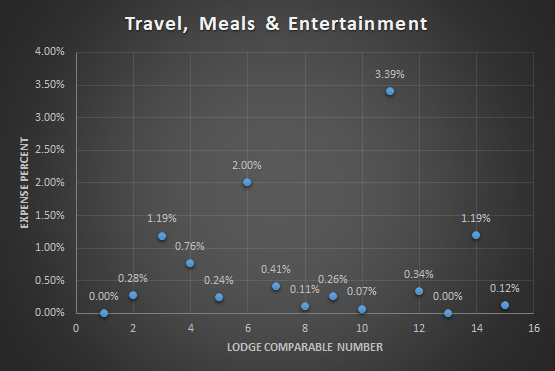
Travel, Meals & Entertainment:
Travel, meals & entertainment expense is not tied to revenue production. The general rule for deductions related to meals and entertainment expenses is that you can deduct up to 50% of the cost of meals and entertainment, or “an amount that is reasonable in the circumstances”, whichever is less.
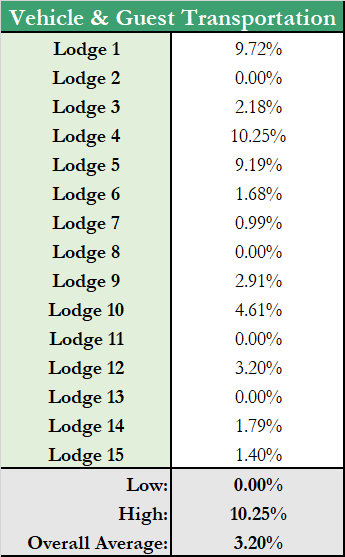
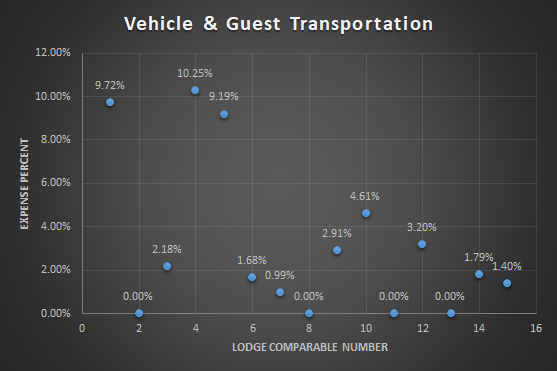
Vehicle & Guest Transportation:
As it sounds, this expense relates to transporting guests to and from the lodge and would be expected to fluctuate with occupancy. This expense will vary greatly between the type of access the lodge has, ie. drive-in, boat-in or fly-in. We have not included any fly-in lodges in the analysis. Lodges 1, 4 and 5 have the highest vehicle and guest transportation expense percentage – theses are all boat-in lodges.
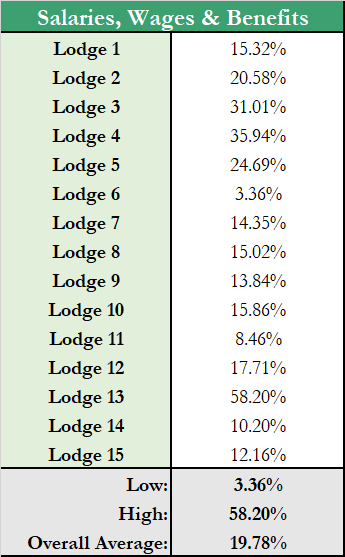
Salaries, Wages & Benefits:
Fishing & Hunting lodge businesses can operate with minimal seasonal staff support needed especially strictly housekeeping operations. Accounting practices for wages expense vary, many owners do not account for their wage in the income & expense statement, & instead their income comes from the net income. Lodge 13 has the highest % and in an appraisal this expense would need to be adjusted to the average of 20% or its valuation using the income approach would be skewed by this expense.
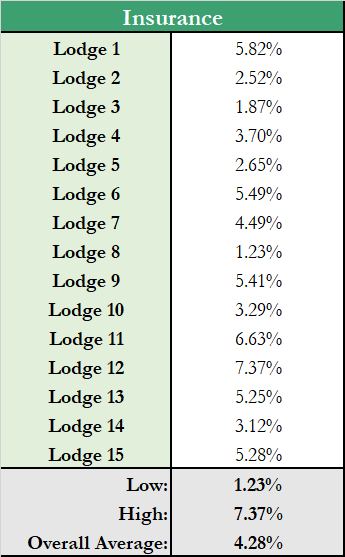
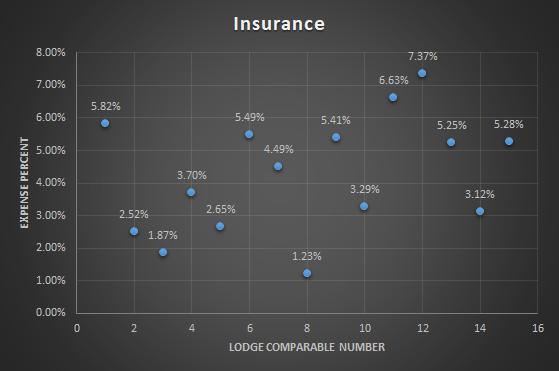
Insurance:
The insurance expense category consists of the cost of insuring the property and its contents against damage or destruction. Insurance rates are based on many factors, including building design and construction, fire detection, etc. Insurance expenses do not vary with occupancy.
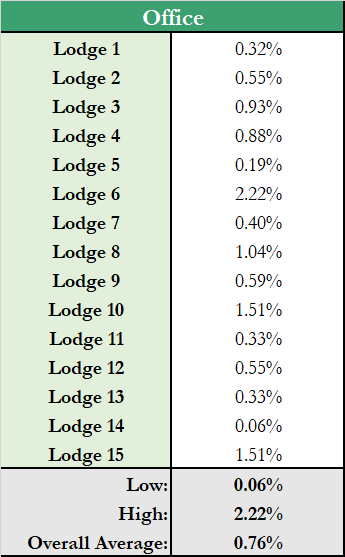
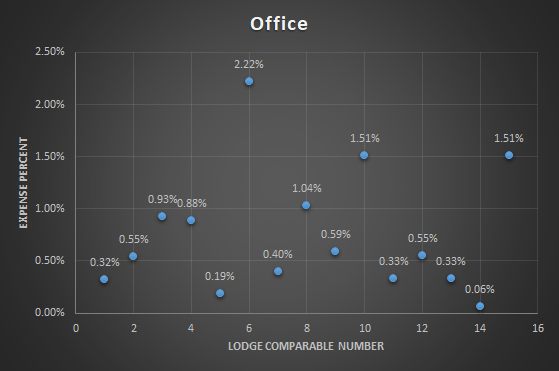
Office:
These are items and services used in a fishing & hunting lodge business that don’t fall into more specific deduction categories. They include general office maintenance, and some electronics and computer hardware.
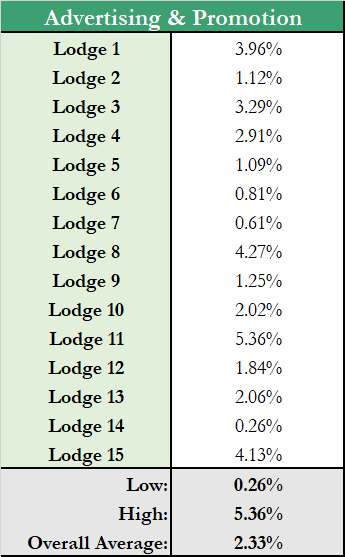
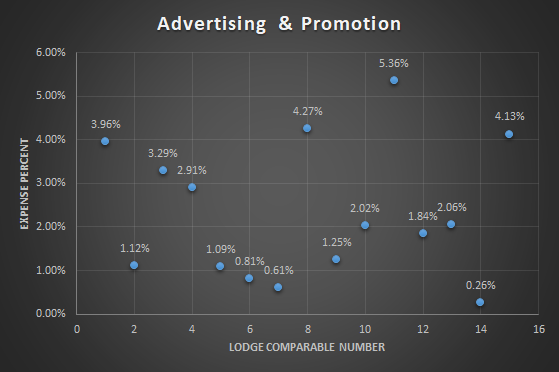
Advertising & Promotion:
Advertising expense consists of all costs associated with advertising, sales and promotion, these activities are intended to attract and retain customers. Marketing can be used to create an image, develop guest awareness and stimulate patronage of a property’s various facilities. Marketing expenses are unusual because although there is a lag period before results are realized, the benefits are often extended over a long period. Depending on the type and scope of the advertising and promotion program implemented, the lag time can be as short as a few weeks or as long as several years. However, the favorable results of an effective marketing campaign tend to linger, and a property often enjoys the benefits of concentrated sales efforts for many months.
Lodge 14 is spending the lowest amount on advertising and promotion as a percentage of revenue and unsurprisingly, this lodge is one of only two lodges in the analysis with decreasing revenue over the 3-year period analyzed. Lodge 6 is the other lodge with decreasing revenue and is spending the 3rd lowest on advertising & promotion.
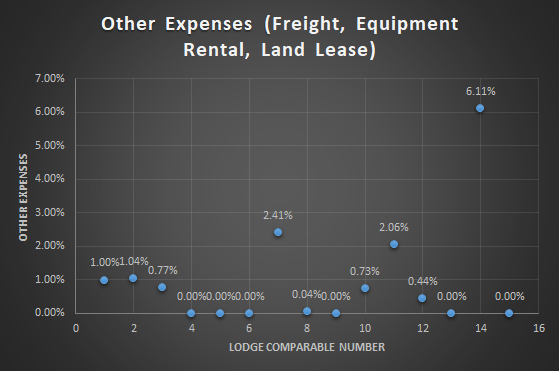
Other (Freight, Equipment Rental, Land Lease):
These are expense items which were only included on a few of the lodge’s income & expense statements and were grouped together as they are relatively rare expenses. As you can see, many of the lodges did not have any expenses relating to these items.

Section 4: Net Income Analysis
Net income, also called net profit, is a calculation that measures the amount of total revenues that exceed total expenses. In other words, it shows how much revenues are left over after all expenses have been paid.
This is the amount of money that the lodge can save for a rainy day, use to pay off debt, reinvest into the business, or distribute to the owners.
Potential buyers want to know that their investment into the lodge will continue to appreciate and that the business will be able to earn them a good return.
Mortgage lenders want to know the lodge is financially sound and able to pay off its debt.
The net income formula is calculated by subtracting total expenses from total revenues. Bear in mind, that since businesses pay taxes on their profits, it would make sense that ownership would try to minimize profits to reduce the taxable income.
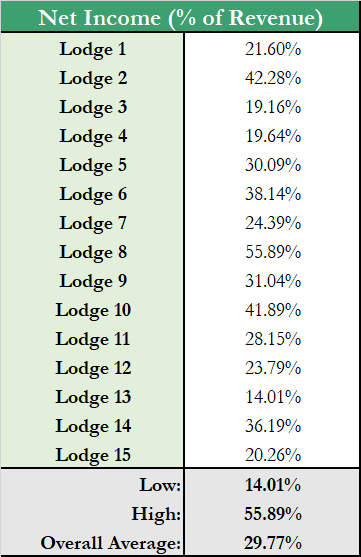
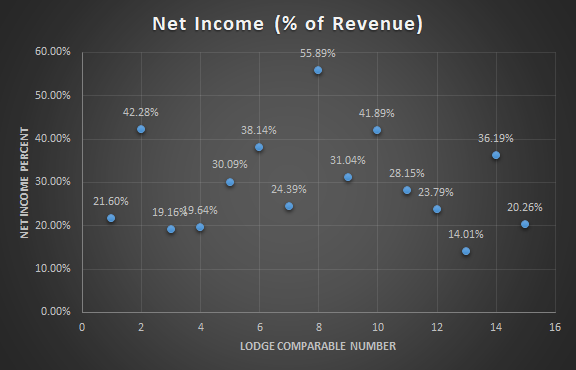
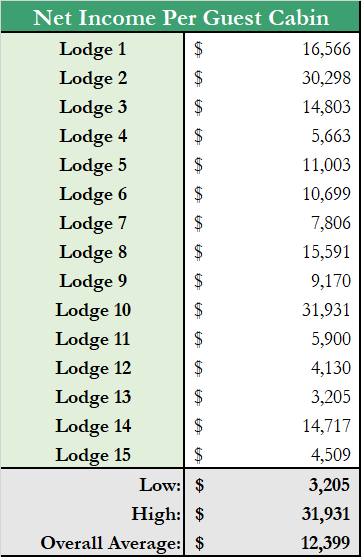
Main Observations:
This analysis simply provides the inverse result of our operating ratio analysis – the lodges with the lowest operating ratios will obtain the highest net income percentage. However, on a per guest cabin basis the results are more interesting. Lodges 2 and 10 are drastically outperforming the other lodges obtaining $30,298 & $31,931 respectively. This can be explained by advising you of 2 facts: Lodge 2 has a popular public restaurant which earns a lot of additional revenue not involving guest cabins, and lodge 10 has the largest and highest quality guest cabins of all 15 lodges in the analysis. As we advised in the objective section – most guest cabins in the analysis ranged from 4-6 beds, lodge 10’s guest cabins are considerably larger with the ability to host more guests.


Section 5: Overall Average Fishing & Hunting Lodge Operation
There are a lot of “double-edged sword” issues on the minds of fishing & hunting lodge operators these days.
As reported by nearly all owners interviewed over the past 3 years, occupancy is the best its been in long time. Exchange rates and interest rates have been favorable for the industry for an extended period of time now, so it is natural to assume that both will eventually start trending upward in the near future.
If an owner, potential buyer, or lender wanted to be conservative in their business projections – utilizing the average statistics presented throughout this report is one option. However, you must be aware of the “flaw of averages,” which states that plans based on assumptions about average conditions usually go wrong.
This basic law shows up everywhere in business, distorting accounts and undermining forecasts. Whenever an average is used to represent an uncertain value, it ends up distorting the results because it ignores the impact of the inevitable variations.
A better option when making projections is to examine the comparable operating statements presented above that are most similar to your operation (this is why number of guest cabins, type of access, packages offered and lodge quality were presented). Make projections based on your business’ operating history while giving consideration to these similar operations performance.
Furthermore, you should examine where the overall economy is heading, especially exchange rates (which have a large influence on lodges that rely heavily on American Guests) before making any projections for your business.

This article has been prepared by Frontier Hospitality Advisor for general information only. Frontier Hospitality Advisor makes no guarantees, representations or warranties of any kind, expressed or implied, regarding the information including, but not limited to, warranties of content, accuracy and reliability. Any interested party should undertake their own inquiries as to the accuracy of the information. Frontier Hospitality Advisor excludes unequivocally all inferred or implied terms, conditions and warranties arising out of this article and excludes all liability for loss and damages arising there from.