Overview of the Outdoor Tourism Industry in the Nipissing District of Ontario
OUTDOOR TOURISM INDUSTRY IN NIPISSING:
TOURISM ACTIVITY
The size and shape of the tourism industry depends on how many visitors there are, where and how long they stay, what activities they engage in, and so on. The demand for services generated by visitors determines the nature of the tourism sector’s workforce: what occupations need to filled, and for what period of time (seasons).
The level of tourism activity is often related to the seasons, with some regions attracting visitors during the summer while others are prominent winter destinations. That tendency is evident in Nipissing. Slightly over half of all visitors come during the third quarter of the year (July, August and September).
The table below indicates the number and percentage of visitors who come from Canada and from Ontario, as well as the number and percentage of visitors from the top five places of origin.

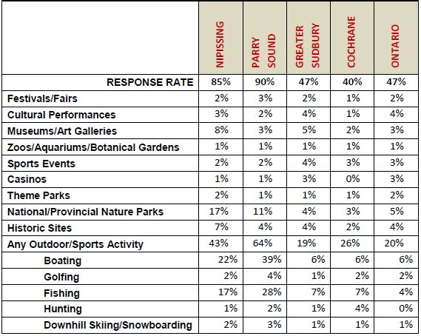
The largest single source of visit origins for Nipissing is Nipissing itself, at 17% of all visits. Nipissing also receives a sizeable proportion of its visitors from further away in Ontario, starting with 5% of its visits originating in each of Toronto and York. Most visitors to Nipissing are either coming for pleasure or to visit friends and family in equal proportions. The table below provides figures for what activities visitors engaged in.

60% of visitors to Nipissing stay overnight. Nipissing is distinguished for the large proportion of overnight visitors staying in campgrounds or RV facilities. As well, another notable proportion stay in commercial cottages or cabins.
DISTRIBUTION OF TOURISM SECTOR ESTABLISHMENTS ACROSS NIPISSING:
Of the total number of tourism firms in Nipissing (394), over half (220, or 56%) are to be found in North Bay. Among firms with 20 or more employees, 47 of 57 (82%) are located in North Bay. Coming a more distant second is West Nipissing, with 72 tourism establishments, accounting for 18% of the total. Third place belongs to Temagami, with 33 establishments (8% of the total).
SUPPLY:
By far, the most prominent establishments are among limited-service eating places and full-service restaurants, together accounting for over 40% of all establishments profiled. The following lists the top ten categories with the most number of establishments:
- Limited-service eating places (90 establishments)
- Full-service restaurants (84)
- Housekeeping cottages and cabins (25)
- Motels (24)
- Hotels (18)
- RV parks and campgrounds (17)
- Hunting and fishing camps (16)
- Fitness and recreational sports centres (15)
- All other amusement and recreation (e.g. billiard clubs, mini-golf, outdoor adventure) (14)
- Recreational and vacation camps (10).
To find Ontario Fishing & Hunting lodges for sale, visit our Marketplace.
ANALYSIS OF ANNUAL TOURISM DEMAND IN NORTHEASTERN ONTARIO:
HIGH YIELD AVID ANGLERS
- 90,000 visitors (27% of RTO13)
- $57.1 Million (24% of RTO13)
- US Avg spend = $2,360/trip
- CDN Avg spend = $920/trip
Fishing is a premier product for Northeastern Ontario – people come to the area specifically to fish (Northern Ontario overall attracts anglers at 4 times the rate of all overnight tourists). Most anglers in Northern Ontario are Canadian, but Americans are higher yield (stay 1 night longer on average). Most avid anglers are older men (average age is 52 years), but future growth is expected from young people and women. Fly‐fishing attracts new anglers at a higher rate than freshwater anglers, and tends to attract higher incomes and education levels, who will travel farther. Region 13A does not have direct access to the US, which is a challenge – but 13A is the most successful in attracting overnight visits (60% Ontario, 40% US). Ensuring the fishing experience presented exceeds standards for lodging, food and beverage, retail, etc. is very important for retaining this market.
HIGH YIELD NATURE BASED TOURISTS
- 64,000 visitors (35% of RTO13)
- $22.0 Million (33% of RTO13)
- US Avg spend = $860/trip
- CDN Avg spend = $630/trip
Over half of the high yield Nature‐Based Tourists to Region 13A are Ontario residents (55%), and 19% American. About 1/5 of RTO 13’s overnight tourists were engaged in an outdoor activity – BUT Ontario cannot attract Nature‐Based tourists at the same rate as the western Provinces ‐ therefore high‐yield market share is smaller. Emerging trend of “glamping” is a strong opportunity area for Region 13A (with existing establishments in Timmins, Mattawa) – way to attract tourists who want to engage in outdoor activities but don’t want to “rough it”. Tourists tend to be older in Northern Ontario (average age 55) – opportunity to sell more passive outdoor experiences focus on authentic experiences and wellness. Opportunity to attract young outdoor‐oriented tourists with short, active adventure.
SNOWMOBILE TOURISTS
- 30,000 visitors (37% of RTO13 overnight visits)
- $8.7 Million (37% of RTO13)
- CDN Avg spend = $330/trip
Most promising target markets for snowmobile tourists in Northern Ontario are Canadians in Ontario & Manitoba, and near‐border states – but most American snowmobile tourists have not travelled to Canada in the past 2 years, and most travel north‐south (more difficult for Region 13A to attract). Hard to attract tourists from near markets because they have similar terrain – domestic tourists only travel for 2‐4 nights, and require extra time/fuel to get to Northern Ontario (cost and access issues). Appealing to “casual” snowmobilers to engage in the activity as part of a “winter experience” might increase use of hotels/motels OR pair with ice fishing. Northeastern Ontario has strong snowmobile clubs, but there are issues with connectivity of trails, heavy reliance on volunteers, and aging grooming equipment – requirement for local community support.
NORTH AMERICAN HUNTERS
- 76,000 visitors to RTO 13 (28% of Ontario)
- $37.0 Million (42% of Ontario)
- Combined NA Avg spend = $640/trip
This is a very niche market (hard to attract new visitors) – but Northern Ontario captures 28% of the province’s North American hunters annually and 42% of their spending (US contributes half of hunting revenues). Most hunters in Northern Ontario are older men (average 55 years old), but it is becoming more common for women ‐ opportunity to develop multi‐generational hunting trips and focus on “eat local” initiatives. Length of trip in Northern Ontario is on average 6 nights, and more hunters are on pleasure trips, but most nights are spend in unpaid lodging (i.e. private cottages). Approximately 64% of all North American hunters in Region 13 live in Northern Ontario (49,000); other Ontario residents make up 20% (15,000), followed by Americans at 16% (12,000) – difficult to market inter‐region travel at the sub‐regional level, and Canada’s market is declining. American hunters tend to be more formally educated and affluent, but few have been to Canada – opportunity to attract new tourists from Texas & NY. About 8 in 10 hunters in Northern Ontario also go fishing on overnight pleasure trips = opportunity for co‐packaging.
NORTH AMERICAN MOTORCYCLE TOURISTS
- 47,000 to 58,000 visitors to RTO 13 (12,000‐14,500 in 13A)
- $16‐$20 Million in RTO 13 ($3‐$4 Million in 13A)
Very small niche market for Northern Ontario. About 40,000 motorcycle tourists live in Toronto and half have travelled to Northern Ontario = largest potential domestic market for the region. American motorcycle tourists make up 47% of this market, but are concentrated in “fair weather” regions (California & Texas). Region 13C is the most successful in drawing US tourists. 25% of Northern Ontario visitors and 20% of the spending took place in Region 13A. Most N.A. motorcycle tourists are middle aged men (35 to 64). Motorcycling tends to be the primary purpose of trip for this market, but few Canadian tourists engage in other popular outdoor adventures (fishing, hiking, etc.), and they tend to prefer small family‐owned accommodations. Motorcycle sales are declining and more research is required to understand the nature of this activity market in Northern Ontario.
Source: NeONT Strategic Plan
This article has been prepared by Frontier Hospitality Advisor for general information only. Frontier Hospitality Advisor makes no guarantees, representations or warranties of any kind, expressed or implied, regarding the information including, but not limited to, warranties of content, accuracy and reliability. Any interested party should undertake their own inquiries as to the accuracy of the information. Frontier Hospitality Advisor excludes unequivocally all inferred or implied terms, conditions and warranties arising out of this article and excludes all liability for loss and damages arising there from.


